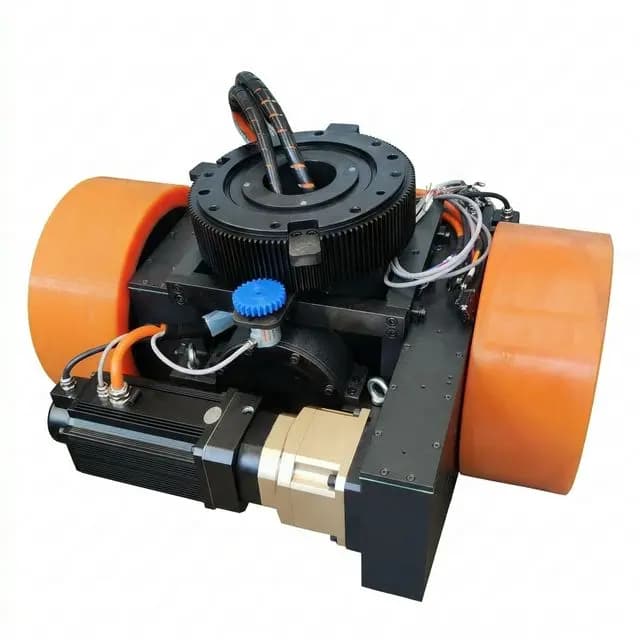
AGV Drive Wheel Sizing for Ramp Climbing: Breakover Angles, Normal Force Shifts, Traction Limits, and Thermal Duty
Size AGV drive wheels for ramps: calculate traction, breakover clearance, motor torque, and thermal duty. Use the worked example and send a route-specific RFQ.
When specifying an AGV drive wheel assembly, a ramp can govern selection even when level travel needs little torque. In the illustrative model below, rolling resistance is assumed to be 2% of normal load; adding a 6° (10.5% grade) climb raises steady tractive demand to 6.2 times the level value.
Sizing only for flat-ground cruising can overlook four failure modes:
- Dynamic Traction Loss: The vehicle stalls and spins its drive tires on the slope, even though the motor has surplus torque, because weight transfer unloaded the driven axle.
- Chassis High-Centering and Wedge Hang-Ups: Inadequate breakover clearance or rigid suspension kinematics causes the vehicle frame to bottom out on the ramp apex or wedge at the ramp toe, hanging the drive wheels in mid-air.
- Inverter
I^2tThermal Shutdown: The sustained grade force forces brushless DC or permanent magnet synchronous motors (PMSM) into extreme thermal overload, tripping motor controller protection halfway up the ramp. - Downhill Regenerative Overvoltage Trips: On the descent, back-EMF and regenerated current overcharge the DC bus because the battery management system (BMS) cannot absorb the peak energy, causing the inverter to cut drive torque.
Scope and Engineering Context (Global / English, November 1, 2026): This technical guide provides mobile robot mechanical engineers, systems integrators, and OEM procurement teams with a preliminary calculation and RFQ framework for sizing drive wheels, suspension compliance, polyurethane tire compounds, and electromagnetic brakes for slope operation.
Limits and method: The numerical examples are reproducible engineering calculations, not measured vehicle tests or a product approval. They assume straight-line motion, known wheel loads, equal drive sharing, and the stated friction and efficiency inputs. Multi-caster suspension loads, cornering, floor joints, wear, and repeated warm-start duty require vehicle-specific checks. Standards applicability depends on the destination market and vehicle design.
For component selection, review our AGV forklift steering wheel selection guide and forklift AGV load and traction selector, or submit your ramp route specifications to our engineering team.
1. The Physics of Ramp Resistance: Force Decomposition on Slopes
When an Automated Guided Vehicle (AGV) or Autonomous Mobile Robot (AMR) operates on a horizontal surface, the tractive effort required to maintain steady velocity is governed almost entirely by wheel rolling resistance and mechanical driveline friction. On an incline, gravitational acceleration resolves into two orthogonal vectors that fundamentally alter vehicle equilibrium:
- Parallel Gradient Force (
F_slope): Acts downward along the plane of the slope, opposing vehicle ascent and accelerating vehicle descent. - Perpendicular Weight Component (
F_perp): Is balanced by the total contact normal force,m * g * cos(theta), in this planar model.
Total Tractive Force Demand:
F_tractive = F_slope + F_roll + F_acc

Where:
F_slope = m * g * sin(theta)
F_roll  = m * g * cos(theta) * c_r
F_acc   = m * a
Where:
m: Gross vehicle laden mass (kg), including chassis, batteries, tooling, and maximum rated payload.g: Gravitational acceleration (9.81 m/s^2).theta: Ramp angle in degrees (theta = atan(Grade % / 100)).c_r: Coefficient of rolling resistance of the elastomeric tire against the industrial floor (dimensionless; use a measured or supplier-validated value for the actual tire, load, and floor).a: Target linear acceleration rate along the slope (m/s^2; a design input).
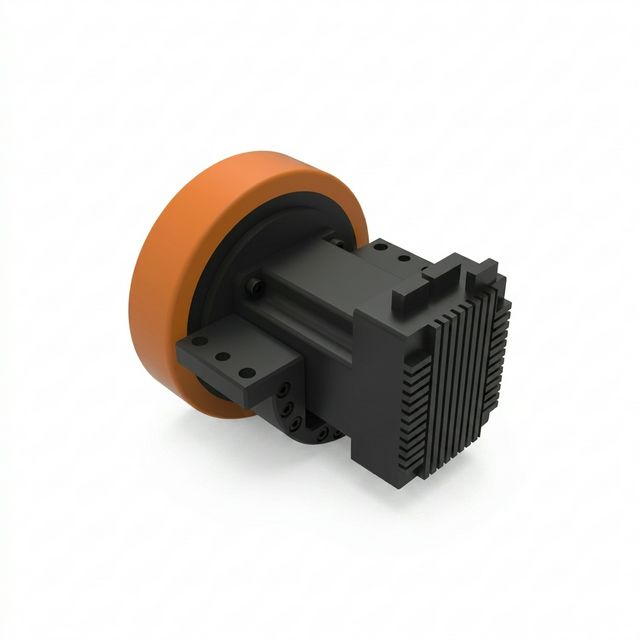
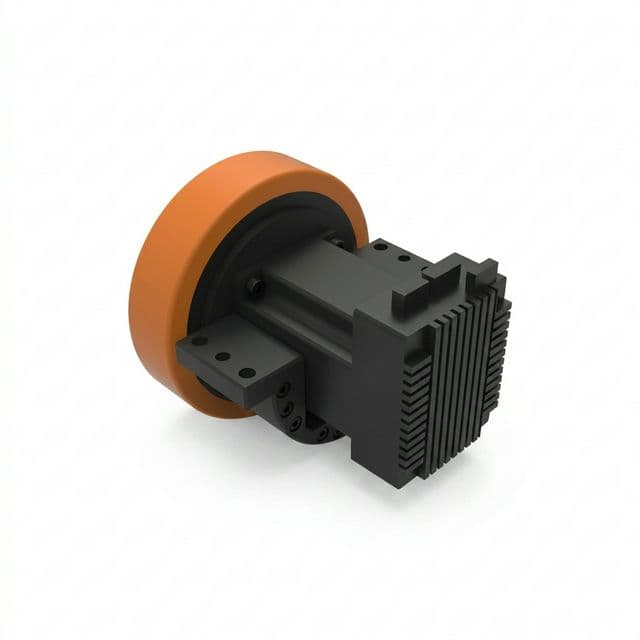
Product illustration for packaging context. The image does not establish gearbox, brake, traction, or incline ratings; confirm those against the selected unit’s datasheet.
Comparing Flat vs. Incline Resistance
To illustrate the sheer magnitude of the slope penalty, consider a 2,000 kg gross weight AMR with polyurethane drive wheels (c_r = 0.02) cruising at constant speed (a = 0):
- Flat Concrete Floor (
theta = 0 deg):F_roll = 2000 * 9.81 * 1.0 * 0.02 = 392.4 N. - 3° Incline (5.2% Grade):
F_slope = 2000 * 9.81 * sin(3 deg) = 1026.8 N.F_roll = 2000 * 9.81 * cos(3 deg) * 0.02 = 391.9 N. Total steady-state force:1418.7 N(3.6x increase over flat ground). - 6° Incline (10.5% Grade):
F_slope = 2000 * 9.81 * sin(6 deg) = 2050.8 N.F_roll = 2000 * 9.81 * cos(6 deg) * 0.02 = 390.2 N. Total steady-state force:2441.0 N(6.2x increase over flat ground).
If this vehicle must stop and restart on the 6° slope with an acceleration of a = 0.35 m/s^2, dynamic acceleration force adds F_acc = 2000 * 0.35 = 700 N, bringing peak tractive demand to 3,141 N—an 8.0x surge over standard level cruising!
2. Dynamic Normal Force Redistribution: Why Drive Wheels Spin Out
The most common mistake in AGV drive sizing is assuming that the drive wheel's normal force remains identical to its static flat-ground weight distribution. In reality, as the vehicle pitches onto a gradient, the Center of Gravity (CoG) height exerts an overturning moment around the axle plane.
Equilibrium Equations for Normal Force
For a rigid two-axle model, let L be the support wheelbase parallel to the road, L_1 the distance from the rear support to the CoG along that plane, and h the CoG height perpendicular to it. With the front uphill and uphill acceleration a, the simplified axle loads are:
N_rear  = [m*g*((L-L_1)*cos(theta) + h*sin(theta)) + m*a*h] / L
N_front = [m*g*(L_1*cos(theta) - h*sin(theta)) - m*a*h] / L
N_rear + N_front = m*g*cos(theta)
Set a = 0 for quasi-static travel. These equations neglect suspension and pitch dynamics. A center drive plus front and rear casters has more than two supports: its drive-wheel load requires spring stiffness, preload, chassis geometry, and contact-state analysis or measurement. It cannot be inferred from these two axle equations alone.
The "Traction Drop" Failure Scenario
Notice the critical term: -m*g*h*sin(theta)/L for the front axle.
- If your vehicle utilizes a front-drive layout (such as a single forward steering drive wheel with two rear load casters), climbing a slope causes the normal force on the drive wheel to decrease as
h_CoGandthetaincrease. - A higher CoG increases load transfer; the amount depends on wheelbase, CoG position, grade, and acceleration, rather than a universal CoG-height threshold.
- Once the drive wheel's normal force
F_N_drivedrops below the tractive threshold, the wheel will spin uncontrollably, even if the drive motor is delivering maximum torque.
The Tractive Friction Limit (mu-Check)
A first screening model for available straight-line traction is:
F_tractive_max = mu_floor * F_N_driveWhere mu_floor is the static/quasi-static coefficient of friction between the polyurethane tread and the floor surface.
For a preliminary traction check:
mu_req = F_tractive / F_N_drive
       = [m*g*sin(theta) + m*g*cos(theta)*c_r + m*a] / F_N_drive
Required: mu_req <= mu_floor / S_mu
Here S_mu is a project-selected allowance. The worked example uses 1.30 as an assumption, not a universal safe value. Measure tire-floor traction under representative loading, temperature, wear, and contamination; tread hardness alone cannot supply a friction coefficient.
The sensitivity table below reuses the worked example’s peak force of 3,801.4 N and assumed minimum total driven-wheel normal load of 12,753 N. Every friction coefficient is an assumed input, not a measurement or floor-specific rating. Available force includes the illustrative 1.30 allowance.
| Assumed friction coefficient | Raw traction limit (N) | Available force / 1.30 (N) | Peak demand (N) | Screening result |
|---|---|---|---|---|
| 0.20 | 2,551 | 1,962 | 3,801 | Insufficient under these assumptions |
| 0.25 | 3,188 | 2,453 | 3,801 | Insufficient under these assumptions |
| 0.30 | 3,826 | 2,943 | 3,801 | Insufficient with the allowance |
| 0.35 | 4,464 | 3,434 | 3,801 | Insufficient with the allowance |
| 0.40 | 5,101 | 3,924 | 3,801 | Clears this arithmetic screen only |
| 0.50 | 6,377 | 4,905 | 3,801 | Clears this arithmetic screen only |
Engineering decision: If measured traction with the required allowance is below demand, more motor torque will increase slip. Review minimum driven-wheel load, suspension contact, payload, speed/acceleration, route grade, and tested tread options before approving a larger motor.
3. Ramp Transition Geometry: Breakover Angles and Suspension Compliance
Gradeability is not just about steady-state hill climbing; it is equally constrained by the geometric transitions at the ramp toe (bottom entry) and the ramp apex / crest (top exit).
1. Ramp Breakover Angle (beta) Calculation
Use a consistent angle convention: breakover capacity beta_cap is the maximum change in road direction that the chassis can straddle. For a symmetric, ideal two-support model with the critical underside point at the midpoint:
beta_cap = 2 * atan(2 * H_eff / L)
Required: theta_transition < beta_cap
Equivalent: H_eff > (L / 2) * tan(theta_transition / 2)
Angles in the calculation must use consistent units. L is the supporting contact wheelbase and H_eff is the loaded midpoint clearance after tire wear, tire deflection, and suspension sag. Off-center low points, wheel radius, overhangs, rounded transitions, and multi-support layouts need a CAD sweep of the actual contact geometry.
At an 8% ramp-to-level crest, theta_transition = atan(0.08) = 4.574°. With L = 1,200 mm, the ideal midpoint clearance is 24.0 mm before any project-specific allowance for joints, tolerances, or chassis motion. An 8% ascent followed directly by an 8% descent has twice the direction change and needs a different check.
2. Suspension Articulation Across Transitions
For a center drive between end casters, a convex crest raises the floor toward the chassis midpoint. The drive suspension needs compression travel; bottoming out or belly contact can unload other wheels. At a concave ramp toe, the center floor lies below the end-support chord and the drive wheel needs downward droop to maintain contact. Travel alone does not prove adequate normal force; check preload and the full spring-force curve.
For a sharp ramp-to-level transition centered between two end supports, the ideal midpoint offset from their contact chord is approximately:
delta_mid = (L / 2) * tan(theta_transition / 2)For L = 1,600 mm and theta_transition = 6°, this is 41.9 mm. It is a geometry estimate, not an automatic ±41.9 mm suspension specification: verify both directions, neutral ride position, linkage motion ratio, wheel radii, caster contact states, and local joint allowances. See the AGV drive wheel suspension comparison for layout considerations; use vehicle-specific geometry for release.
4. Motor Torque & Thermal Duty: S1 Continuous vs. S2/S3 Incline Ratings
A common trap in B2B drive wheel procurement is confusing a motor's continuous rated torque (T_cont) with its short-time peak torque (T_peak).
Use the motor supplier’s declared duty and speed-torque limits. S1 describes continuous running to thermal equilibrium. S2 describes a specified short run from a cold condition followed by enough rest to cool. S3 describes intermittent periodic operation where starting losses are insignificant; a route with repeated acceleration or electrical braking may need another declared duty type or a manufacturer thermal model.
IEC 60034-1:2026 is the rating and performance reference for motors within its scope. Its duty labels do not grant a fixed peak-torque multiplier or certify an integrated motor/inverter. Confirm the applicable edition and test conditions with the supplier.
Sizing Rules for Ramp Ascent
- Calculate the complete route profile: Include flat travel, slope acceleration, steady climb, stops, descent, and repeat interval. Add gearbox losses and auxiliary loads separately.
- Check torque at speed: Compare both the motor and inverter envelopes at minimum battery voltage, actual cooling, and ambient temperature; a zero-speed peak rating cannot establish ramp capability.
- Check warm-start overload duration: Include ramp transit and any queue or restart on the incline. Request allowable current and torque versus time at the expected initial temperature, plus controller protection settings.
- Verify the repeated mission: An RMS torque screen,
T_rms = sqrt(sum(T_j² * t_j) / sum(t_j)), can identify an undersized continuous rating if torque is proportional to current. It does not model speed-dependent cooling, iron losses, or temperature accumulation; obtain supplier thermal confirmation for the full cycle.
For an RFQ, send the route duty profile and calculated torque-speed points so the supplier can confirm limits and cooling assumptions.
5. Downhill Descent: Regenerative Braking and DC Bus Overvoltage
While climbing tests a drive wheel's motor torque, descending a slope tests its electrical drive architecture and functional safety.
When an AGV moves downhill, gravity acts as the driving force. To prevent the vehicle from accelerating uncontrollably, the drive wheel motor must deliver negative braking torque (operating as an electrical generator in Quadrant II or Quadrant IV).
The DC Bus Overvoltage Trap
For steady downhill travel, a simplified estimate of DC-link regeneration is shown below. Include inverter losses if not already included in the electrical efficiency; acceleration, rotational inertia, and transient stops require a separate energy calculation:
P_regen = [m*g*sin(theta) - m*g*cos(theta)*c_r] * v_descent * eta_gear * eta_motorWhere:
eta_gear: Planetary gearbox forward/reverse efficiency (use measured reverse-drive efficiency for the selected gearbox).eta_motor: Electrical motor generator efficiency (use generator efficiency at the operating point).
The energy must be accepted by the battery, dissipated in a suitably rated braking resistor, or handled by a validated stopping strategy. At high state of charge or low temperature, the battery/BMS may restrict or disconnect charge acceptance. Limits depend on chemistry, temperature, state of charge, and BMS configuration; there is no universal cutoff temperature or DC-bus trip voltage.
An overvoltage fault can reduce available electrical braking. Check the actual drive fault response and the vehicle’s behavior if regeneration is unavailable.
Sourcing & Architectural Mitigations
ISO 3691-4:2023 covers driverless truck safety and verification. Its public listing does not establish a specific scanner architecture, chopper threshold, or holding factor. Confirm requirements from the applicable full standard and vehicle risk assessment.
- Regeneration path: Verify battery charge acceptance at the worst allowed temperature and state of charge. If using a chopper/resistor, check bus thresholds, resistance limits, peak power, energy per descent, repeated duty, cooling, and fault monitoring.
- Coordinated stopping and holding: A holding brake is usable for dynamic stops only when its manufacturer rates the required speed, energy, frequency, and lifetime work. Verify torque handover and braking on loss of electrical regeneration; see AGV electromagnetic brake sizing and safety.
- Detection coverage: Validate stopping distance and scanner coverage on the actual downhill route, including response delays and vehicle pitch. A fixed worst-case field or a validated speed/field-switching strategy may be suitable. Scanner field expansion does not dissipate regenerative energy.
6. Step-by-Step Engineering Worked Example
To bring these physical principles into practice, consider a hypothetical warehouse AMR. These inputs are assumptions for calculation, not measured test data or an approved vehicle specification:
Application Parameters
- Gross Laden Vehicle Mass (
m):2,500 kg - Incline Specification:
6.0 degangle (10.51%grade) - Ramp Length (
s):25 meters - Target Ascending Velocity (
v):1.2 m/s(4.32 km/h) - Target Incline Acceleration (
a):0.30 m/s^2 - Drive Layout: Dual differential drive with two driven wheels and four spring-loaded corner casters.
- Drive Wheel Diameter (
D):250 mm(r = 0.125 m) - Polyurethane Compound: 92 Shore A Cast Polyurethane (
c_r = 0.020) - Floor Surface: Polished industrial concrete (
mu_floor = 0.50) - Assumed Flat-Ground Driven-Wheel Load (
F_N):14,715 Ncombined, or 60% of gross vehicle weight (7,357.5 Nper wheel). - Minimum Driven-Wheel Load Assumption: For all modeled ramp states, assume a combined driven-wheel normal load of
F_N_climb = 2500 * 9.81 * 0.52 = 12,753 N(6,376.5 Nper wheel). This is a design input requiring a suspension model or measurement, not a result derived from CoG height. Unequal wheel loading requires a per-wheel check. - Gearbox Ratio (
i):25:1planetary reduction (eta_gear = 0.91). - System Voltage:
48 VDCnominal.
Step 1: Calculate Tractive Force Demand
F_slope = m * g * sin(6 deg) = 2500 * 9.81 * 0.10453 = 2,563.6 N

F_roll = m * g * cos(6 deg) * c_r = 2500 * 9.81 * 0.99452 * 0.020 = 487.8 N

F_acc = m * a = 2500 * 0.30 = 750.0 N

F_total_peak = 2,563.6 + 487.8 + 750.0 = 3,801.4 N

F_total_steady = 2,563.6 + 487.8 = 3,051.4 N
With dual drive wheels sharing tractive load equally:
- Peak force per drive wheel:
F_wheel_peak = 3801.4 / 2 = 1,900.7 N. - Steady force per drive wheel:
F_wheel_steady = 3051.4 / 2 = 1,525.7 N.
Step 2: Friction & Slip Verification (mu-Check)
Maximum permissible tractive force before tire slip:
F_traction_max = mu_floor * F_N_wheel = 0.50 * 6,376.5 N = 3,188.3 NRequired friction coefficient during acceleration:
mu_req = F_wheel_peak / F_N_wheel = 1,900.7 / 6,376.5 = 0.298Safety margin against tire slip:
S_mu = mu_floor / mu_req = 0.50 / 0.298 = 1.68 (clears assumed S_mu >= 1.30)Conclusion: This arithmetic screen clears the assumed 1.30 margin at mu = 0.50. It does not prove actual grip. If measured friction falls to mu = 0.25, demand exceeds available traction even before the allowance; the vehicle specification must change.
Step 3: Wheel and Motor Shaft Torque
Wheel output torque per drive unit:
T_wheel_peak = F_wheel_peak * r = 1,900.7 N * 0.125 m = 237.6 NmT_wheel_steady = F_wheel_steady * r = 1,525.7 N * 0.125 m = 190.7 NmMotor shaft torque required (before 25:1 gearbox reduction at 91% efficiency):
T_motor_peak = T_wheel_peak / (i * eta_gear) = 237.6 / (25 * 0.91) = 10.44 NmT_motor_steady = T_wheel_steady / (i * eta_gear) = 190.7 / (25 * 0.91) = 8.38 NmStep 4: Motor RPM & Mechanical Power
Wheel rotational speed at v = 1.2 m/s:
n_wheel = (v * 60) / (pi * D) = (1.2 * 60) / (pi * 0.250) = 91.67 RPMMotor shaft speed:
n_motor = n_wheel * i = 91.67 * 25 = 2,292 RPMSteady-state mechanical power output per motor on incline:
P_mech = T_motor_steady * 2*pi * n_motor / 60
       = 8.38 * 2*pi * 2292 / 60 = 2,010 W (2.01 kW)
Total motor-shaft mechanical power for both units is approximately 4.02 kW; wheel-contact tractive power is 3051.4 * 1.2 = 3.66 kW. Battery input must also cover motor/inverter losses and auxiliaries. At 48 V, even the lossless 4.02 kW value corresponds to about 84 A total; size wiring and protection from the actual electrical duty, minimum bus voltage, and applicable limits.
Step 5: Duty Cycle and Thermal Rating Verification
At constant 1.2 m/s, transit time is 25 / 1.2 = 20.8 s. Starting from rest at 0.30 m/s² takes 4.0 s and 2.4 m to reach that speed. With no final deceleration, the ideal climb becomes 4.0 + (25 - 2.4) / 1.2 = 22.8 s; include stopping, queues, and restart time in the required duty.
- Submit 10.44 Nm peak and 8.38 Nm steady per motor, with the final operating speed of 2,292 RPM, to the supplier. Confirm both the motor and inverter limits across the acceleration curve.
- Level steady motor torque is approximately 1.35 Nm per unit under these assumptions. This value alone cannot set the continuous rating for repeated ramp routes.
- A cold-start 30-second overload declaration does not prove repeated warm-start operation. No motor is approved by this example: request thermal evaluation, gearbox torque/load ratings, BMS limits, and route validation before purchase release.
7. Comparative Selection Table: Ramp Sizing Failure Modes & Solutions
| Failure mode | Physical cause | Detection / telemetry | Engineering correction | Procurement evidence |
|---|---|---|---|---|
| Drive-wheel slip | Demand exceeds friction times driven-wheel normal load | Wheel RPM rises without matching vehicle speed | Check load sharing, contact force, acceleration, and tested tread | Tire-floor traction test and minimum wheel-load envelope |
| High-centering at crest | Effective underside clearance is insufficient | Chassis contact or wheel unloading | Sweep loaded, worn-tire geometry over the crest | CAD contact study with joint/tolerance allowance |
| Ramp-toe contact loss | Center wheel cannot droop to the concave transition | Contact force falls or suspension reaches travel limit | Revise droop, preload, or transition profile | Travel and spring-force curves across the route |
| Motor/inverter thermal trip | Torque-time profile exceeds warm-start limits | Model-specific current/temperature fault logs | Review ratio, cooling, speed, and repeat interval | Supplier torque-speed-time and thermal confirmation |
| Descent overvoltage | Regenerated energy exceeds acceptance or dissipation | DC-bus rise and controller fault response | Validate battery, chopper/resistor, and fallback stop | Peak power, descent energy, repeat duty, and fault tests |
| Parked rollback | Holding torque or tire grip is insufficient | Motion while stopped on the maximum slope | Check load sharing, brake condition, and grip | Minimum holding torque and separate dynamic-stop ratings |
8. Incline Drive Wheel Sizing & RFQ Engineering Checklist
Before finalizing purchase orders for motorized steering or heavy-duty drive wheels intended for incline routes, review this verification checklist:
- Route: Record maximum laden mass, CoG envelope, grade in degrees and percent, ramp length, crest/toe profile, joint steps, and speed limits.
- Geometry: Verify
theta_transition < 2 * atan(2 * H_eff / L)for the ideal midpoint screen; complete a CAD contact sweep with worn tires, deflection, sag, and overhangs. - Suspension: Check compression at crests, droop at concave toes, contact states, preload, and minimum per-wheel normal force across the route.
- Traction: Measure representative tire-floor grip and confirm
F_demand <= mu_measured * N_drive / S_muwith an agreed allowance and unequal wheel loads considered. - Motor and gearbox: State wheel radius, ratio, efficiencies, peak/steady torque, operating RPM, wheel loads, and bearing loads; verify supplier envelopes.
- Thermal duty: Provide acceleration, ramp time, queues, descent, dwell, repeat interval, cooling, and initial temperature; do not rely on cold-start S2 alone.
- Electrical descent: Confirm BMS charge acceptance, inverter voltage limits and fault response, and braking resistor power/energy/repeat ratings where used.
- Stopping and holding: Validate actual downhill stopping distance, protective coverage, brake torque handover, tire grip, and holding torque at maximum load and grade.
- Release evidence: Obtain supplier confirmation for the selected unit and vehicle-level tests; keep unresolved inputs out of the approved specification.
9. Frequently Asked Questions (FAQ)
Why does an AGV with sufficient motor torque still spin its wheels when climbing a ramp?
Usable tractive force is limited by tire-floor friction multiplied by the normal force on the driven wheels. Uphill load transfer can unload a front drive axle; suspension travel can also reduce contact force at transitions. Compare force demand with measured grip and the minimum driven-wheel load before increasing motor torque.
How do you calculate ramp breakover clearance?
For a simplified symmetric two-support model, breakover capacity is beta_cap = 2 * atan(2 * H_eff / L). The crest direction change must stay below beta_cap. At an 8% ramp-to-level crest, a 1,200 mm support wheelbase needs about 24.0 mm effective midpoint clearance before a project-specific joint and tolerance allowance. Use loaded, worn-tire geometry and verify the complete underside envelope in CAD.
What is the difference between S1, S2, and repeated ramp duty?
S1 describes continuous running to thermal equilibrium. S2 describes a specified short run from a cold condition followed by sufficient rest to cool. Repeated ramp trips with warm starts need the complete duty profile; S3 assumes starting losses are insignificant, so frequent acceleration or electric braking may require another declared duty type or a manufacturer thermal model. No universal peak-torque multiplier or duration follows from these labels.
Why can downhill descent trigger DC bus overvoltage faults?
The traction motor can regenerate energy during descent. If the battery or BMS cannot accept that energy, DC bus voltage can rise to the controller limit. Check the actual battery charge envelope, inverter thresholds, and braking resistor power and energy ratings. Overvoltage response and available braking torque depend on the drive; validate a coordinated stopping strategy for loss of regeneration.
Must scanner protective fields change on every ramp?
Determine the required protective field from validated stopping distance, response delays, slope geometry, and detection coverage. A fixed field may suffice if it covers the worst case; otherwise use a validated speed and field-switching strategy. A scanner field change cannot absorb regenerative energy or replace a brake, and a flat-ground stopping test does not approve downhill operation.
What safety margin should be used for an incline holding brake?
Agree the holding margin with the vehicle risk assessment and brake supplier; this guide does not claim a universal standard-mandated factor. Screen motor-shaft holding torque using T_hold >= m * g * sin(theta) * r * S_hold / (n_b * i), with the number of effective braked wheels n_b and load sharing stated. This ideal calculation takes no credit for gearbox friction. Also verify tire grip, brake tolerances, wear, temperature, and separate dynamic stopping limits.
10. Partner with an AGV Drive Wheel Manufacturer
A useful supplier review connects the wheel assembly with the actual vehicle and route. VDI 2510 provides AGVS system context; it is not a source for a universal ramp radius or friction coefficient.
Ask the supplier to confirm the selected gearbox’s torque and wheel-load ratings, tire-floor test conditions, motor/inverter thermal envelope, brake holding and dynamic-stop limits, and suspension mounting requirements. Keep each unverified item visible in the RFQ.
Ready to validate your ramp climbing calculations? Submit your payload, maximum gradient, ramp length, and target speed to our engineering team for an application-specific driveline review: