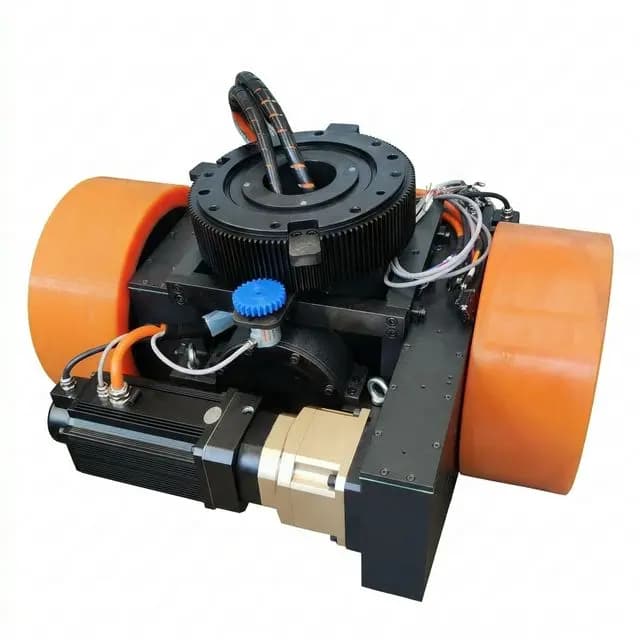
AGV Automated Guided Vehicle Factory Integration Guide
A comprehensive engineering blueprint for planning, safety zoning under ISO 3691-4:2023, and high-load drive wheel selection across modern automotive manufacturing plants. Whether you are deploying a single AGV in factory operations or building entire AGV factories, this guide covers it all.
Standards status checked July 2026: ISO lists the 2023 edition as published and to be revised, with ISO/DIS 3691-4 under development. Use the latest purchased standard and site risk assessment before design release.
Live torque check
158.8 Nm
Live default screen
Factory AGV torque check
Within screening envelope: No boundary warning is active for the selected inputs; still confirm the final coefficient, brake holding, and duty cycle with site tests.
Automotive Factory AGV Layout & Wheel Torque Calculator
Select your deployment zone, adjust vehicle loads and slope profiles, and calculate critical wheel torque requirements aligned with conservative engineering screening bounds.
Configuration Parameters
Required inputs load with conservative defaults. Sliders and select menus constrain invalid values; boundary warnings appear in the result panel.
Calculation Summary
- Wheel radius is fixed at 0.1 m for this screening model and torque includes a 1.35x engineering margin.
- Floor presets: clean epoxy Crr 0.015 / grip 0.55; raw concrete Crr 0.020 / grip 0.45; wet/oily floor Crr 0.020 / grip 0.08.
- Treat results as an AGV in factory planning estimate; verify floor friction, brake holding, wheel load, heat, and supplier duty-cycle data before release.
High-traction polyurethane (93 Shore A) with active suspension module, optimized for frequent start-stop cycles on smooth epoxy floors.
AGV Force Balance Vector Diagram
During acceleration on a factory ramp, the drive wheel must simultaneously overcome inertia, gravity along the slope, and rolling friction. The yellow vector shows the resultant traction demand.
Executive Summary & Reader Value
Key Findings in Automotive Factory AGV Deployment
Key decisions, engineering thresholds, and trade-offs derived from public standards scopes, supplier material positioning, screening calculations, and explicit validation gates.
1. Deployment Dynamics in Modern AGV Factories
Deploying automated guided vehicles (AGVs) in a manufacturing plant, or establishing a dedicated agv automated guided vehicle factory logistics system, demands strict coordination between plant floors, mechanical components, and safety controllers. Unlike standard distribution centers, automotive assembly plants run 24/7 with dynamic, heavy components—such as chassis structures, engines, and heavy sheet metal dies.
In this high-duty-cycle environment, component failure can stop upstream or downstream cells. Therefore, sizing drive assemblies, selecting heavy-duty drive wheel compounds, and designing layout patterns against verified safety and material assumptions represents the difference between a successful automated pilot and a costly operational bottleneck.
2. ISO 3691-4:2023 Safety Zones & Layout Clearance
The deployment layout should be reviewed against the scope of ISO 3691-4:2023, which covers safety requirements and verification for driverless industrial trucks and their systems. The labels below are a planning model for discussion; final zone names, access rules, and scanner fields must be confirmed from the full standard text, vehicle documentation, and site risk assessment.
ISO public metadata checked in July 2026 lists ISO 3691-4:2023 as published and to be revised, with ISO/DIS 3691-4 under development. This page therefore treats the standard as a planning reference and revision-risk checkpoint, not a substitute for clause-level compliance review.
In practice, integrators should separate fenced or access controlled paths from shared human-vehicle paths, then verify stopping distances under the worst payload, floor condition, gradient, and speed profile. ISO 3691-4:2023 provides the safety-requirements and verification frame; it does not remove the need for project-specific validation.
3. Workshop Zone Comparative Analysis
Operating conditions vary wildly across automotive workshops. Wheel drive assemblies must be specified directly for the local floor challenges.
| Workshop Zone | Payload Range | Floor Hazards | IP Rating Req. | Wheel Material Rec. |
|---|---|---|---|---|
| Press Shop | 3,000 - 10,000 kg | Heavy stamping vibrations, oil residue, metal debris | IP54 - IP65 | 95 Shore A Vulkollan (polyurethane) on steel cores |
| Body Shop | 1,500 - 3,500 kg | Welding slag, sparks, metal particulates | IP65 (dust sealed) | Anti-slag Polyurethane (high thermal stability) |
| Paint Shop | 500 - 1,500 kg | Chemical solvents, high humidity, baking heat | Hazardous-area classification required | Static-control polyurethane, value by site requirement |
| Assembly Shop | 1,000 - 2,500 kg | Clean smooth epoxy, high personnel density | IP54 | 93 Shore A High-Traction Polyurethane |
4. Selection Grid: AGV vs AMR for Automotive Assembly
Choosing the mobility framework determines layout flexibility and the corresponding mechanical loads on the drive wheel system.
| Technical Attribute | Automated Guided Vehicle (AGV) | Autonomous Mobile Robot (AMR) |
|---|---|---|
| Path Routing | Fixed paths (Magnetic tape, QR grids, or reflective lasers) | Dynamic obstacle avoidance (SLAM navigation) |
| Typical GVM Capacity | Multi-ton engineered systems; limit must be confirmed by vehicle OEM and route validation | Often lighter sub-assembly trays; exact capacity depends on the AMR platform |
| Drive Wheel Demands | High traction, high torque, continuous 24/7 duty cycle | Frequent omnidirectional movements, lower traction requirements |
| Tire Wear Rate | Often lower and more predictable on fixed routes; verify duty cycle, floor debris, and steering events | Can be higher when frequent path corrections, pivots, or omnidirectional moves dominate the duty cycle |
5. Wheel Dynamics: Preload Springs & Slip Mitigation
A common point of failure on polished epoxy factory floors is drive wheel slippage. On a dual-differential AGV, if the drive wheel loses physical contact with the floor for even a fraction of a second, the encoders record wheel spin that does not match actual vehicle movement. This introduces cumulative navigation errors.
To combat this, modern AGV chassis incorporate mechanical preloading systems. Placing a spring-suspension module on the drive wheel ensures the wheel is forced downward against the floor with a constant normal force.
| Configuration | Drive Layout | Traction Efficacy | Odometry Slip Risk | Best For |
|---|---|---|---|---|
| Single Steer-Drive | 1 steerable drive, 2 casters | Moderate (slips on oil or metal slag) | Low (steer angle is absolute) | Tuggers & light material cart vehicles |
| Dual Differential | 2 independent drives, 4 casters | High (if spring-preloaded correctly) | High (slips translate to angular errors) | Standard assembly and body shop transports |
| Quad Steering-Drive | 4 steerable drive wheels | Maximum (highest traction redundancy) | Very Low (multiple redundant encoders) | Ultra-heavy dies & long-part aerospace lifters |
Friction Coefficient (μ) vs. Wheel Slip Ratio (%)
Dynamic traction peak occurs between 5% and 15% slip ratio. Outside this optimal band, the drive wheel enters macro-slip, where traction drops dramatically. Vulkollan (solid lines) maintains higher grip than standard PU (dashed lines) under both clean epoxy and oily floor conditions in this illustrative screening model. Supplier curves and site friction tests override these example shapes.
6. Tread Material Performance & Life Expectancy
Tread compound selection dictates the coefficient of rolling resistance, thermal dissipation, and service life in heavy manufacturing operations.
| Material Compound | Rolling Resistance | Traction Evidence | Heat Dissipation | Deformation / Flat-Spotting |
|---|---|---|---|---|
| Vulkollan® (Polyurethane) | Very Low (minimal energy loss) | Supplier curve and site friction test required | Excellent, but confirm continuous/transient limits | Very Low (resists flat spots after overnight park) |
| Standard Polyurethane | Low | Supplier curve and site friction test required | Series-specific; confirm continuous and transient limits in the supplier datasheet | Moderate (liable to brief flat-spotting) |
| Industrial Rubber | High | High grip, but validate floor marking wear | Poor (high internal friction generates heat) | High (severe deformation under static heavy loads) |
| Cast Iron / Steel | Negligible | Low grip on coated factory floors | N/A | None (but destroys factory floor finish) |
Paint Shop Static-Control Validation Path
In solvent-handling paint areas, static-control design should be validated as a complete path: chassis bond, conductive or static-dissipative tread, floor coating, and inspection method. The acceptable resistance target is project-specific and should come from the hazardous-area classification and supplier certificate.
7. Navigation Technology & Relocalization Precision
Different navigation systems place unique demands on wheel mechanics. Relocalization benchmarks represent standard vendor-class screening examples; final accuracy must be verified with the selected vehicle, localization stack, floor condition, and commissioning test.
| Method | Stationary Precision | Dynamic Drift | Impact of Slippage | Dust / Slag Vulnerability |
|---|---|---|---|---|
| Reflective Laser (Lidar) | ± 5 mm | Low | Moderate (corrected by reflectors) | Low (lenses must be kept clean) |
| LiDAR SLAM (Natural) | ± 10 mm | High (if environment shifts) | High (depends heavily on wheel odometry) | Moderate (dynamic environment mapping issue) |
| QR Code Grid | ± 2 mm | None (fixed points) | Low (camera reads visual codes) | High (codes get scratched or dirty) |
| Magnetic Tape | ± 3 mm | Very Low | Low (follows tape index physically) | Low (tape can peel under heavy shear) |
8. Gradeability Bounds & Safety Stopping Distances
Industrial plants include floor slope gradients—such as ramps crossing fire containment lines, connections between building structures, or loading dock entries. ISO 3691-4:2023 sets the driverless-truck safety and verification context, while the actual warning and protective field dimensions must be derived from measured stopping distance, response time, slope, payload, and scanner supplier documentation.
| AGV Speed (m/s) | Grade / Slope (%) | Emergency Stop Delay | Min Braking Distance | Example Protective Field |
|---|---|---|---|---|
| 0.5 m/s (Slow) | 0% (Flat) | 220 ms | 0.15 m | 0.65 m planning example |
| 1.0 m/s (Standard) | 3% | 250 ms | 0.48 m | 1.18 m |
| 1.5 m/s (Fast) | 6% | 280 ms | 1.05 m | 1.85 m |
| 2.0 m/s (High-speed example) | 10% | 310 ms | 2.10 m | 3.10 m planning example |
Emergency Stopping Distance Planning Example
Min braking clearance rises quadratically with vehicle velocity. Slopes shift the stopping envelope further out. The solid line tracks a flat floor; dashed lines track 3% and 6% downhill ramps, showing why each project must validate scanner fields from measured braking tests.
AGV Drive Wheel Configuration Layouts
Diagram of standard differential drive wheel configuration (left) versus a single steering-drive wheel configuration (right). Drive wheels are represented in dark color; casters are represented in light color.
9. System Architecture & Fleet Interoperability (VDI 2510 / VDA 5050)
While ISO 3691-4 establishes the safety baseline, managing multi-vendor fleets in automotive plants requires standardized communication. The VDA 5050 standard (Version 3.0.0 as of early 2026) has emerged as the critical interface between AGVs/AMRs and master fleet controllers to prevent vendor lock-in.
VDA 5050: Standardized Communication
Breaks automation silos by standardizing command flows:
- Interoperability: Enables single master control for multi-brand fleets.
- Scope Limit: VDA 5050 handles command/status streams, but does not standardize physical vehicle characteristics (e.g., fork geometry or payload capacity).
- Risk Trade-off: Single-vendor systems are easier to implement initially, but VDA 5050 compliance is necessary for long-term scalability and independence.
VDI 2510 Series (Technical & Operational)
Provides holistic technical implementation boundaries:
- Sheet 1: Peripheral infrastructure interfaces (elevators, fire doors).
- Sheet 2: Safety implementation mapping.
- Sheet 4: Energy concepts and battery integration.
10. Power Management: Opportunity Charging vs. Battery Swapping
Continuous 24/7 operations in automotive factories present severe bottlenecks if energy management fails. The industry is shifting from labor-intensive manual battery swapping to automated opportunistic charging, but the decision involves critical cost and thermal trade-offs.
| Charging Strategy | Ideal Scenario | Trade-offs & Risks | Validation Action |
|---|---|---|---|
| Opportunity Charging (Inductive/Contact) | High-automation cells (e.g., body shop robotic welding) with predictable 2-5 minute idle stops. | Risk: High C-rate micro-charges accelerate LiFePO4 battery thermal degradation if cooling is inadequate. Higher upfront infrastructure cost. | Confirm battery cycle life curves and thermal dissipation models with the AGV vendor. |
| Battery Swapping (Manual/Automated) | Ultra-heavy transport (e.g., 10-ton press dies) where idle time is zero and power draw is massive. | Risk: Requires extra battery inventory, dedicated charging rooms, and labor overhead (or expensive swap stations). | Calculate Total Cost of Ownership (TCO) including facility footprint and maintenance labor. |
| Fleet Navigation Network | Private 5G or segmented industrial wireless for seamless handover. | Risk: High implementation complexity compared to traditional Wi-Fi. | Measure shadow zones, handover events, packet-loss bursts, and OEE impact. |
11. Practical Plant Case Studies
Press Shop Stamp Die Transport Retrofit
Challenge: An automotive OEM in Michigan, US is representative of press-shop projects where an 8-ton die-transfer AGV must climb a 4.5% ramp into die storage. The pre-RFQ risk is motor stall, tread heat build-up, and delamination when the wheel compound is not matched to load, ramp, and debris conditions.
Analysis: Heat buildup inside standard polyurethane treads is the screening concern when load, ramp grade, duty cycle, and debris raise tread temperature beyond the selected series envelope. Treat softening and bond failure as validation risks, not assumed outcomes.
Solution: The drive system was upgraded in the design screen to a dual-differential assembly using high dynamic-load polyurethane wheels, with preload set by calculated tractive demand and then verified with load cells before production approval.
Validation target: Ask the supplier to provide duty-cycle thermal curves, wheel-load verification results, and wear inspection intervals before converting this scenario into a production specification.
Powertrain Assembly Line SPS Cart Fleet Optimization
Challenge: A German-style powertrain assembly layout represents fleets of SPS (Set Parts System) AGV tuggers navigating by LiDAR SLAM on clean epoxy. Slight dust buildup can cause wheel slip, accumulating encoder drift and triggering nuisance safety stops.
Analysis: Standard wheel casters and drive wheels did not provide sufficient dynamic grip when minor dust settled on the epoxy floor and traction reserve dropped below the screening threshold.
Solution: The fleet was respecified with high-traction polyurethane treads and integrated micro-grooves to channel dust out of the contact patch. The SLAM algorithm was optimized to recalibrate position dynamically when laser readings matched key structural columns.
Validation target: Track localization residuals, slip events, emergency-stop frequency, and throughput before and after the tread change; do not treat supplier examples as guaranteed percentage improvements.
Paint Shop Skid Transfer Static-Control Gate
Challenge: A paint-area skid transfer route uses lighter AGVs, but the operating risk shifts from torque capacity to electrostatic discharge, solvent-area classification, and chemical exposure.
Analysis: The calculator can still screen torque, but it cannot approve the static-control design. The buyer must verify wheel resistance, floor resistance, bonding continuity, and cleaning chemistry as one documented path.
Solution: Shortlist conductive or static-dissipative polyurethane only after the site safety engineer defines acceptance limits, then run a commissioning inspection with the selected AGV and floor coating.
Validation target: Record resistance readings, floor-condition notes, and wheel certificate references before approving production use in the paint shop.
Drive Wheel Thermal Profiles under Continuous Load
Heat generation and dissipation comparison under identical heavy-load duty cycles. The profile is illustrative: every tread candidate must remain inside its supplier-published continuous and transient temperature envelope.
12. System Assumptions, Operating Boundaries & Failures
Every automated guided vehicle system operates within strict physical boundaries. Treat these as pre-design validation gates before committing an RFQ or safety file:
- Ramp Grade: Above a conservative 10% slope screening threshold, request supplier confirmation for brake holding, downhill stopping distance, gearbox thermal load, and tread traction.
- Floor Traction: Oily-floor scenarios in this page use an illustrative traction coefficient of 0.08. Confirm the actual coefficient with a site friction test before relying on torque or stopping-distance estimates.
- Static Control Limits: Conductive wheels and dissipative floors require a documented inspection plan. Dirt buildup can act as an insulator, so acceptance limits should come from the paint-shop hazardous-area assessment.
13. Engineering References & Data Sources
The technical benchmarks and calculation parameters published in this guide use the following evidence hierarchy. Public pages support scope and terminology; final values must be verified against purchased standards, supplier datasheets, and plant tests before procurement.
- ISO 3691-4:2023: Driverless industrial trucks and their systems - Safety requirements and verification (published 2023; page checked July 2026). Used here to frame the driverless-truck safety and verification scope, not to reproduce protected clause-level limits. ISO public metadata also lists the 2023 edition as to be revised, with ISO/DIS 3691-4 under development; re-check the lifecycle status before design release.
- ISO 13849-1:2023: Safety of machinery - Safety-related parts of control systems - Part 1: General principles for design. ISO's public summary states that it provides a methodology for safety-related control systems and does not itself specify required performance levels for particular applications.
- DIN ISO 815-1:2016: Rubber, vulcanized or thermoplastic — Determination of compression set — Part 1: At ambient or elevated temperatures (Used to benchmark flat-spot recovery kinetics).
- Covestro AG Polyurethane Elastomers Datasheet (Vulkollan 93/95 Shore A): Covestro Vulkollan brand and material overview used for general Vulkollan material positioning such as high dynamic properties and wear resistance. Site-specific friction and lifetime figures remain supplier-validation items.
- Blickle & Räder-Vogel Engineering catalogs: Blickle technical guide and Räder-Vogel technical information used for caster and wheel selection concepts such as rolling resistance, tread hardness, and load-rating review. Exact curve values should be taken from the selected wheel series.
- VDI 2510 & VDA 5050: VDA 5050 Standard Interface (Version 3.0.0 as of 2026) is referenced for multi-vendor fleet interoperability. The VDI 2510 series provides the operational boundaries. Public summaries and GitHub schemas are not a replacement for full risk assessments.
Frequently Asked Questions
Comprehensive answers to regulatory, deployment, and wheel mechanical questions for B2B integrators.
Regulatory & Safety Compliance
Plant Environment & Deployment
Wheel Engineering & Maintenance
Dynamics, Odometry & Slippage
Action Plan: Implementing Factory AGV Drive Systems
Follow this prioritized checklist when planning wheel drive assemblies for automotive factory lines:
- Perform Floor Friction Audit: Measure floor surface friction under wet/dry conditions to select the correct target friction value.
- Verify Layout Zoning: Mark restricted, shared, and hazard zones on the factory floor layout to confirm clearances and speed profiles.
- Select Tread Compound: Shortlist Vulkollan or another high dynamic-load polyurethane for severe duty, and specify conductive or static-dissipative variants only when the paint-zone safety file requires them.
- Submit Specifications for Engineering Review: Use calculation values from this page to request custom quotes for drive assemblies.
Related AGV automated guided vehicle factory engineering resources
Continue researching high-load wheel modules, forklift integrations, system safety checklists, and motor selection equations.
- AGV Automotive Factories Drive Wheel & Route Fit Calculator

- AGV Forklift & Automated Forklifts Fit Checker
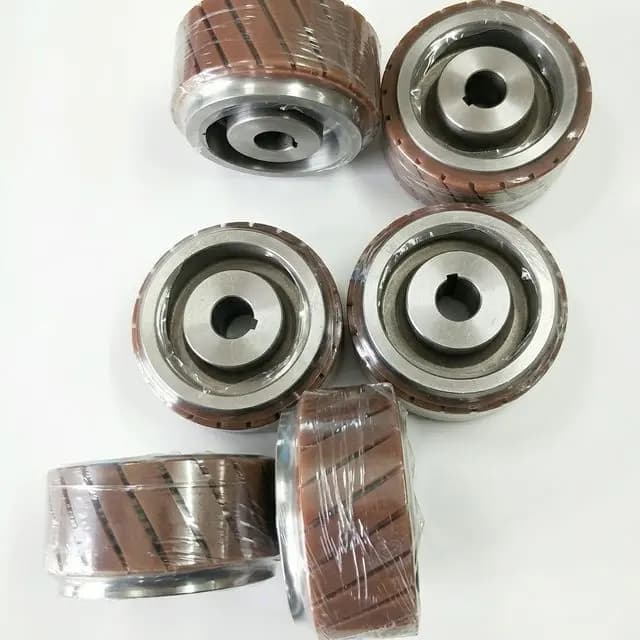
- Material Handling Robot Safety Checker
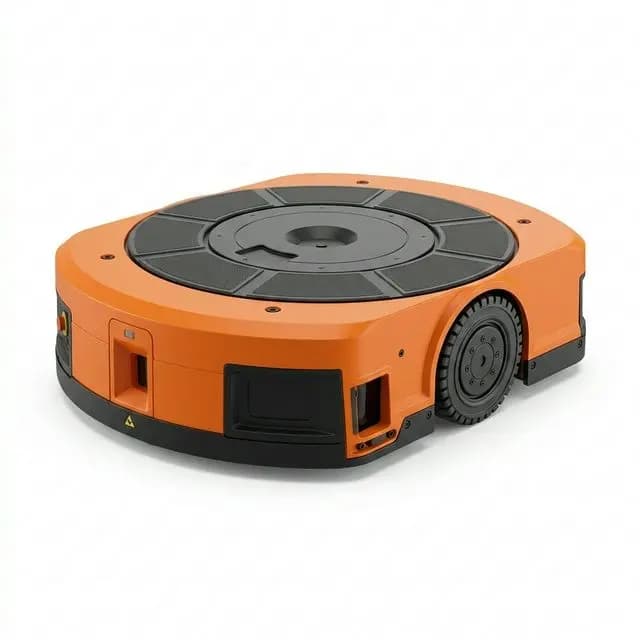
- 310mm Mecanum Wheel Forklift Retrofit Guide

- AGV Drive Wheel RFQ Checklist for OEM Buyers
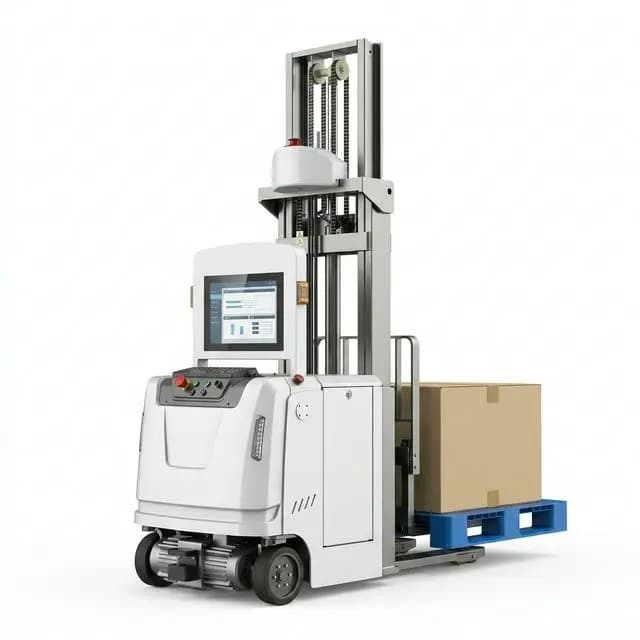
- How to Calculate AGV Drive Wheel Torque and Motor Sizing
- Transitioning to AGV Automation Factories: Fleet Sizing Guide
- AGV Drive Wheel for Manufacturing Factory